Note
Go to the end to download the full example code.
CSI Preprocessing.denoising Tutorial
# !pip install pysensing
In this tutorial, we will be implementing a simple csi.preprocessing.denoising tutorial using the pysensing library.
import sys
sys.path.append('../..')
import pysensing.csi.preprocessing.denoising as denoising
import pysensing.csi.dataset.get_dataloader as load_data
import matplotlib.pyplot as plt
import numpy as np
Load the data
# Define the plot function

def plot_csi_heatmap(csi_data):
    """
    Plot WiFi CSI heatmap.

    """
    data_shape = csi_data.shape

    if len(data_shape) == 2:
        csi_to_plot = csi_data
    elif len(data_shape) > 2:
        csi_to_plot = csi_data.reshape(-1, data_shape[-1])
    else:
        raise ValueError("The input data should have at least 2 dimensions.")

    plt.figure(figsize=(15, 8))
    plt.imshow(csi_to_plot, aspect='auto', cmap='viridis')
    plt.colorbar(label='CSI Amplitude')
    plt.title('WiFi CSI Heatmap')
    plt.xlabel('Time Index')
    plt.ylabel('Subcarrier Index / Flattened Antenna-Subcarrier Index')
    plt.show()
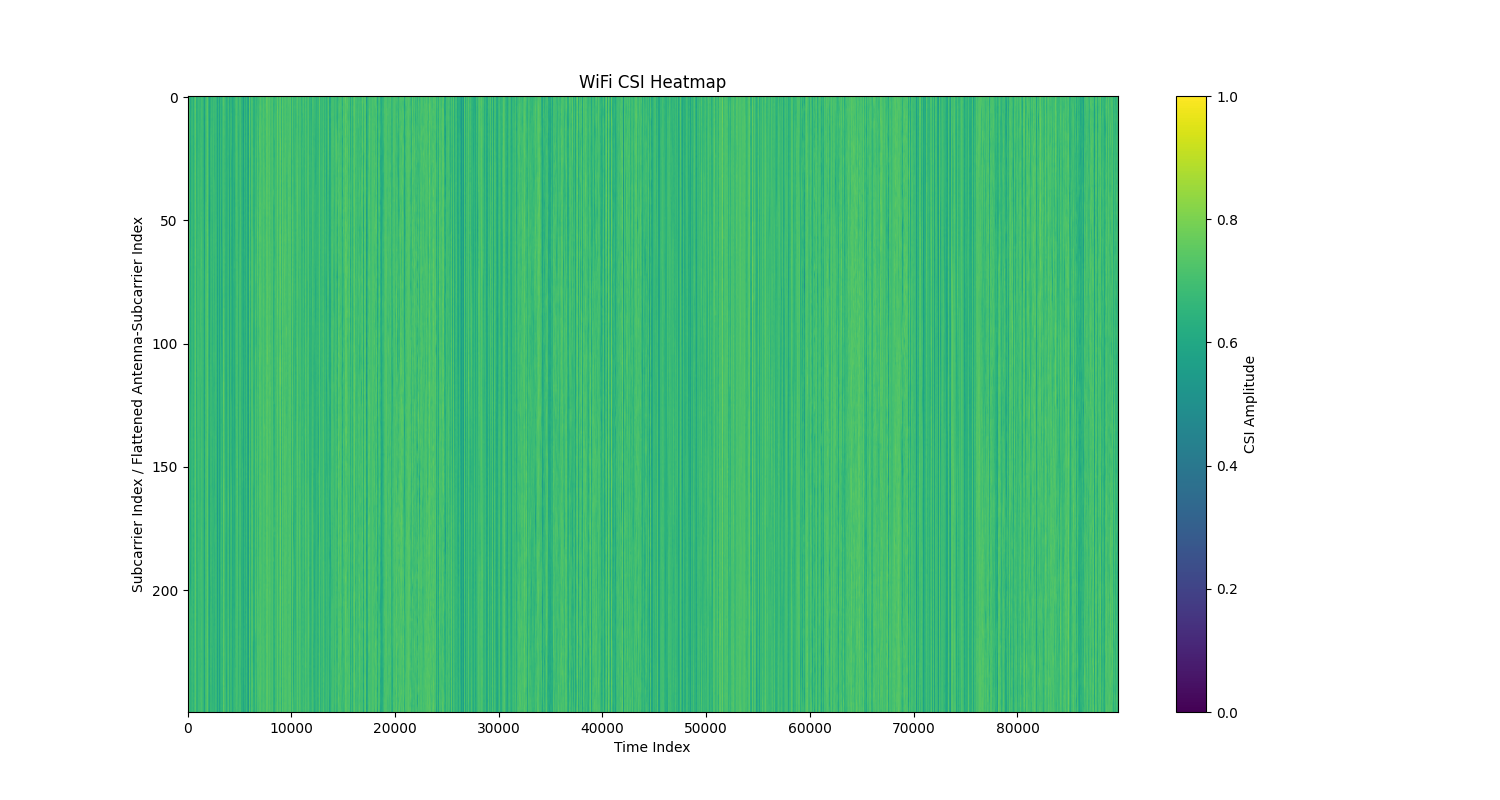
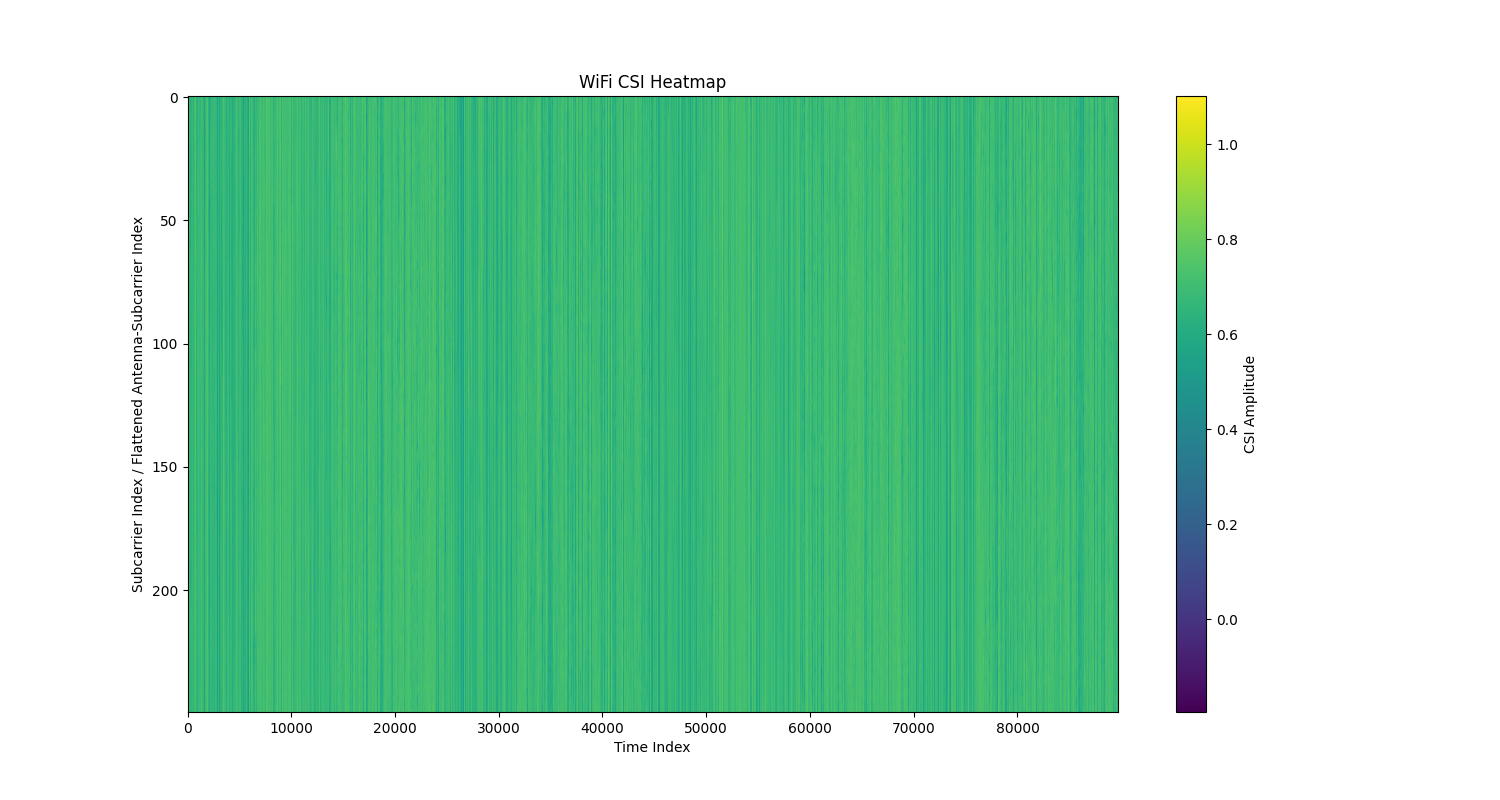
Load the data
_, test_loader = load_data.load_classification_dataset('UT_HAR',batch_size=1)
example_csi_data_list = []
for data in test_loader:

    data, label = data
    example_csi_data_list.append(data)

example_csi_data = np.concatenate(example_csi_data_list, axis=-1)
plot_csi_heatmap(example_csi_data)
/data1/msc/zyj/yunjiao_csi/1028/yunjiao_csi/tutorials/csi_source/data/csi
using dataset: UT-HAR DATA
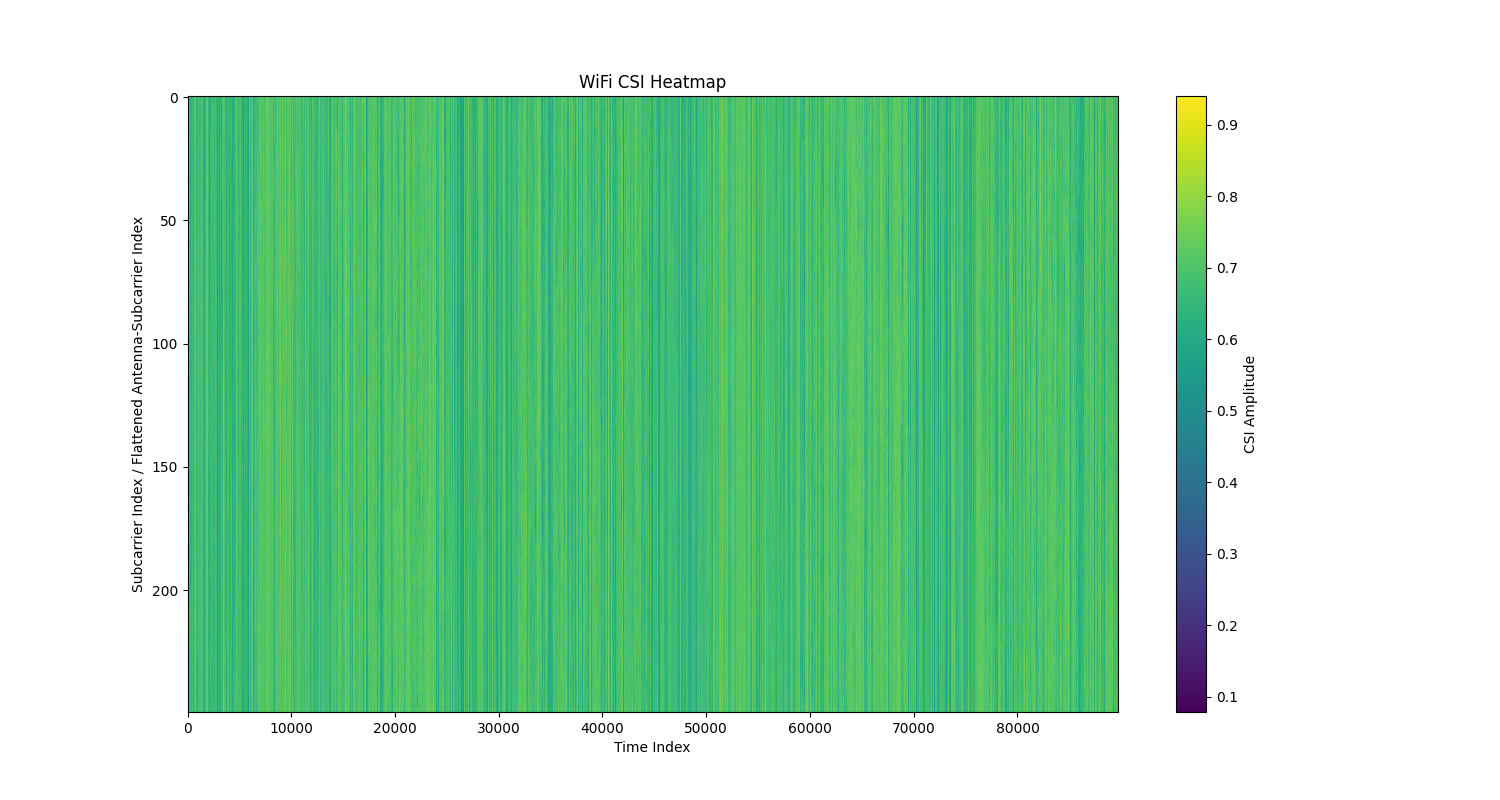
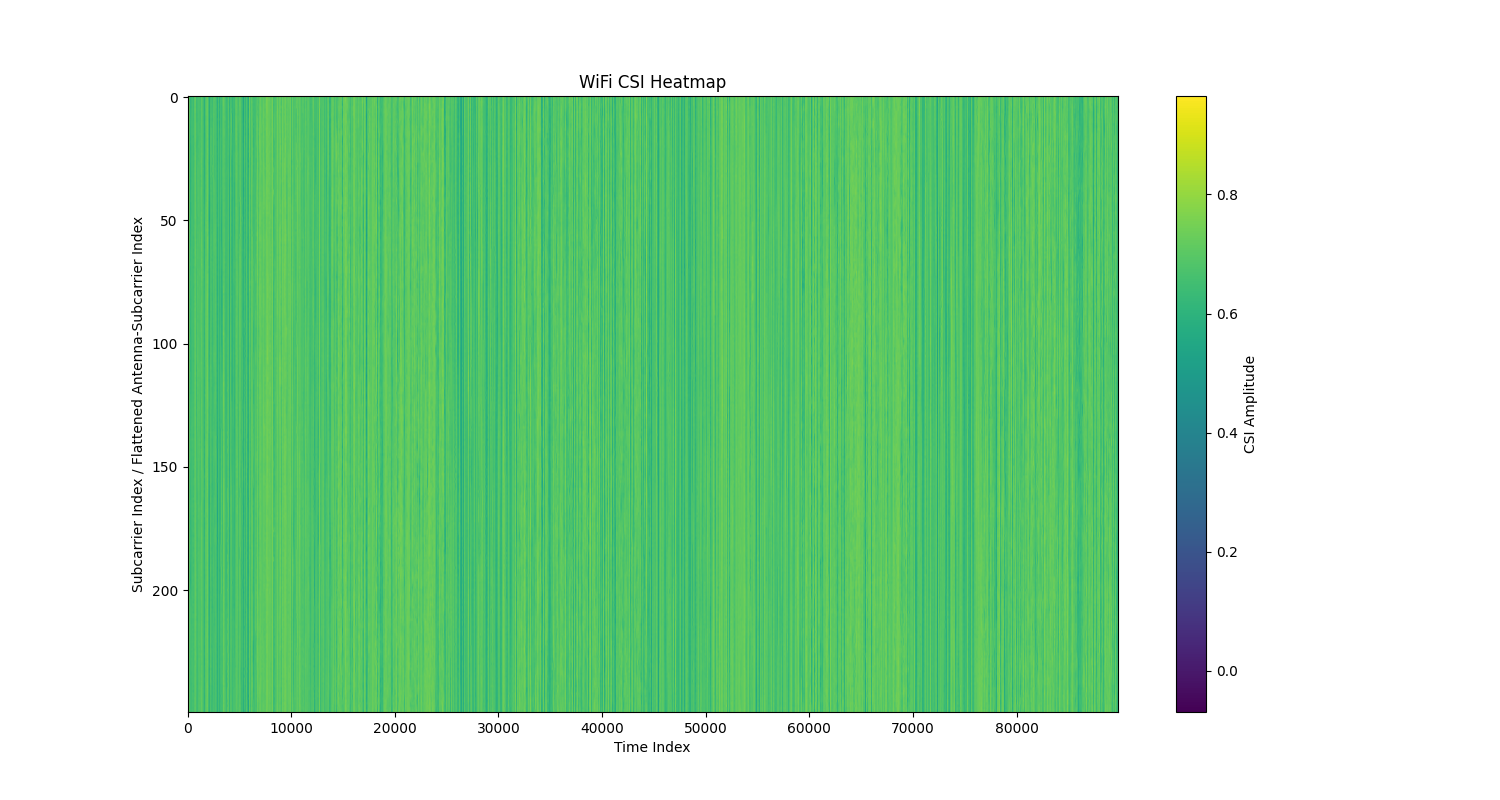
1. lowpass filter
Use lowpass filter denoising
wifi_csi_filter = denoising.lowpass_filter(20, 500)
filtered_csi_data = wifi_csi_filter(example_csi_data)
plot_csi_heatmap(filtered_csi_data)
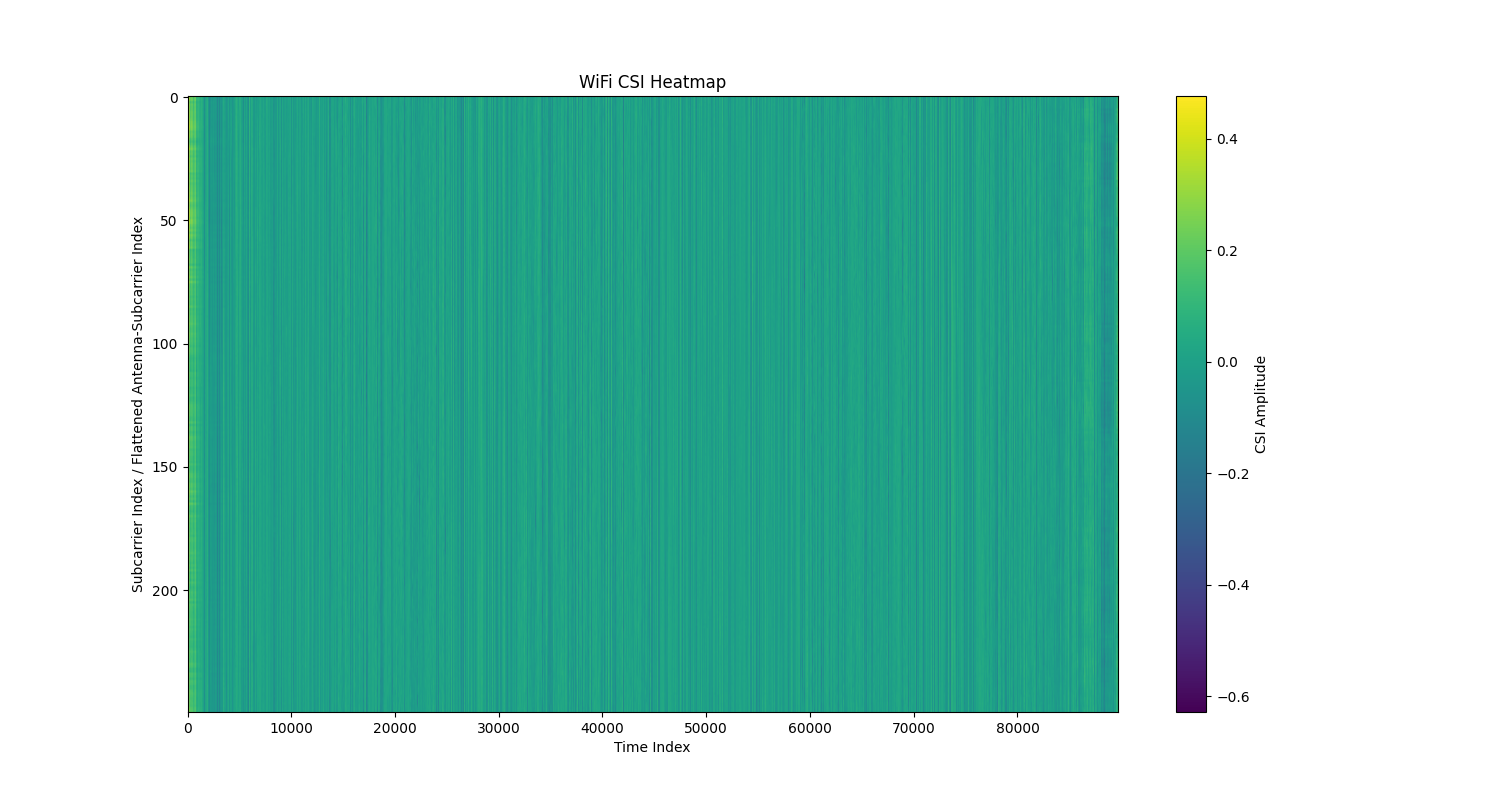
2. bandpass filter
Use bandpass filter denoising
wifi_csi_filter = denoising.bandpass_filter(0.1, 30, 500)
filtered_csi_data = wifi_csi_filter(example_csi_data)
plot_csi_heatmap(filtered_csi_data)
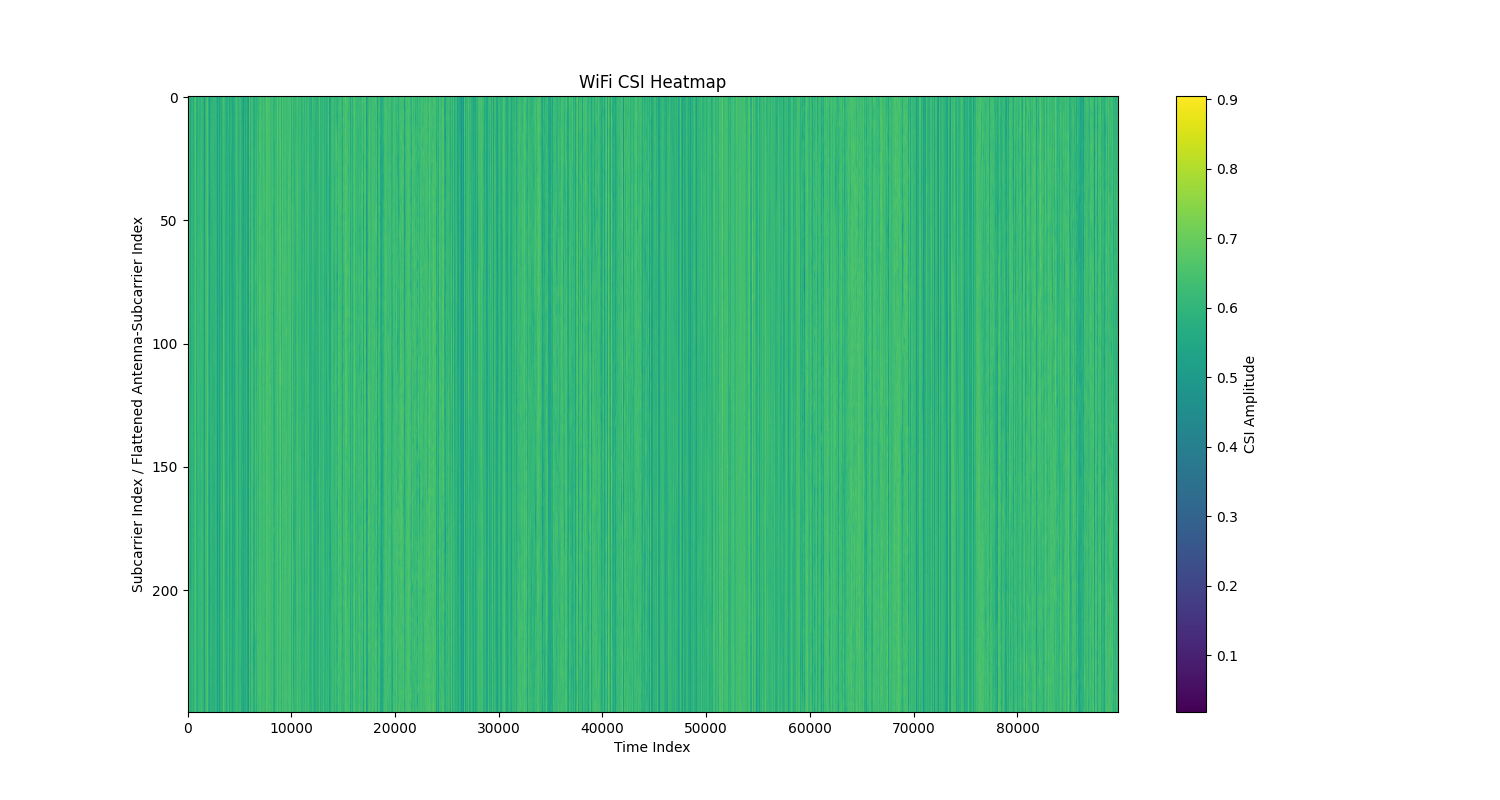
3. elliptic filter
Use elliptic filter denoising
wifi_csi_filter = denoising.elliptic_filter(cutoff_freq=20, passband_ripple=0.5, stopband_attenuation=60, sample_rate=500)
filtered_csi_data = wifi_csi_filter(example_csi_data)
plot_csi_heatmap(filtered_csi_data)
4. dwt filter
Use dwt filter denoising
dwt_filter = denoising.dwt(wavelet='db4', level=2, threshold_ratio=0.4)
filtered_csi_data = dwt_filter(example_csi_data)
plot_csi_heatmap(filtered_csi_data)
5. stft filter
Use stft filter denoising
stft_filter = denoising.stft(window='hann', nperseg=256, noverlap=128, threshold_ratio=0.4)
filtered_csi_data = stft_filter(example_csi_data)
plot_csi_heatmap(filtered_csi_data)
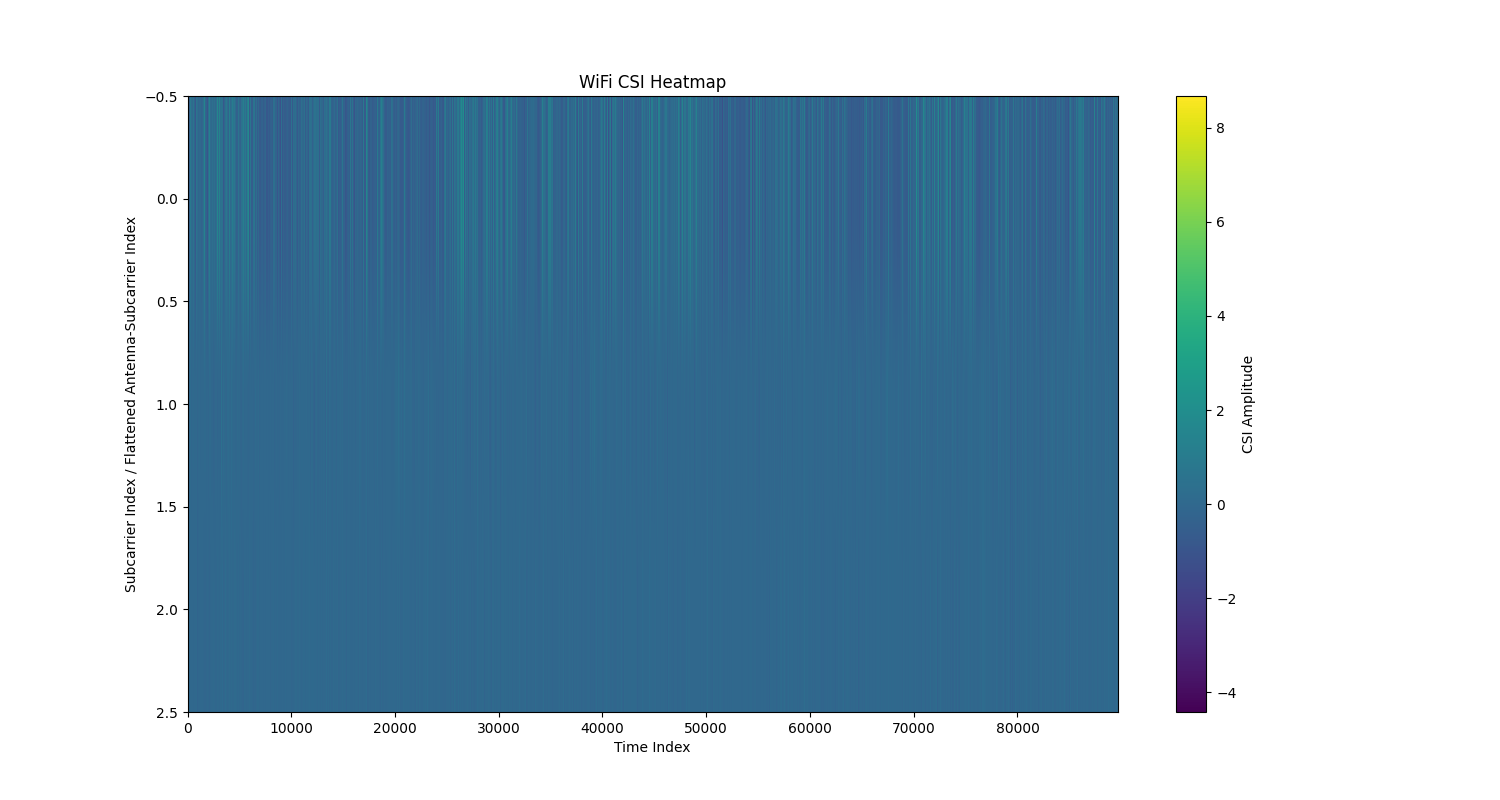
6. pca filter
Use pca denoising
pca_filter = denoising.pca(n_components=3, dimension_to_filter=0)
reduced_csi_data = pca_filter(example_csi_data.squeeze())
plot_csi_heatmap(reduced_csi_data)
And that’s it. We’re done with our CSI augmentation.deformation tutorials. Thanks for reading.
Total running time of the script: (0 minutes 23.846 seconds)
